#======================================
# 原创代码无删减,编写不易,论文使用本代码绘图,请引用:www.tcmbiohub.com
# 祝大家投稿顺利!
#脚本一,单独另存为.R格式
#============================
# Copyright (C) 2011 John Colby
# http://github.com/johncolby/SVM-RFE
# Revised for stable use in all-gene SVM-RFE workflows
svmRFE.wrap <- function(test.fold, X, ...) {
# Wrapper to run svmRFE function while omitting a given test fold
train.data <- X[-test.fold, , drop = FALSE]
test.data <- X[test.fold, , drop = FALSE]
# Rank the features
features.ranked <- svmRFE(train.data, ...)
return(list(
feature.ids = features.ranked,
train.data.ids = row.names(train.data),
test.data.ids = row.names(test.data)
))
}
svmRFE <- function(X, k = 1, halve.above = 5000) {
# Feature selection with Multiple SVM Recursive Feature Elimination (RFE) algorithm
n <- ncol(X) - 1
if (n < 1) {
stop("No feature columns found in X. The first column must be group labels, and the rest must be features.")
}
# Scale data up front so it doesn't have to be redone each pass
cat("Scaling data...")
X[, -1] <- scale(X[, -1])
cat("Done!\n")
flush.console()
pb <- txtProgressBar(min = 1, max = n, initial = 1, style = 3)
i.surviving <- 1:n
i.ranked <- n
ranked.list <- vector(mode = "numeric", length = n)
# Recurse through all the features
while (length(i.surviving) > 0) {
if (k > 1) {
# Subsample to obtain multiple weights vectors (i.e. mSVM-RFE)
folds <- rep(1:k, length.out = nrow(X))[sample(nrow(X))]
folds <- lapply(1:k, function(x) which(folds == x))
# Obtain weights for each training set
w <- lapply(folds, getWeights, X[, c(1, 1 + i.surviving), drop = FALSE])
w <- do.call(rbind, w)
if (is.vector(w)) {
w <- matrix(w, nrow = 1)
}
# Normalize each weights vector
w <- t(apply(w, 1, function(x) {
denom <- sqrt(sum(x^2))
if (denom == 0 || is.na(denom)) {
rep(0, length(x))
} else {
x / denom
}
}))
# Compute ranking criteria
v <- w * w
vbar <- apply(v, 2, mean)
vsd <- apply(v, 2, sd)
vsd[is.na(vsd) | vsd == 0] <- 1e-12
cval <- vbar / vsd
} else {
# Only do 1 pass (i.e. regular SVM-RFE)
w <- getWeights(NULL, X[, c(1, 1 + i.surviving), drop = FALSE])
cval <- as.vector(w * w)
}
# Rank the features: smaller criterion removed first
ranking <- sort(cval, index.return = TRUE)$ix
if (length(i.surviving) == 1) {
ranking <- 1
}
if (length(i.surviving) > halve.above) {
# Cut features in half until less than halve.above
nfeat <- length(i.surviving)
ncut <- round(nfeat / 2)
nleft <- nfeat - ncut
cat("Features halved from", nfeat, "to", nleft, "\n")
flush.console()
pb <- txtProgressBar(min = 1, max = max(1, nleft), initial = 1, style = 3)
} else {
ncut <- 1
}
# Update feature list
ranked.list[i.ranked:(i.ranked - ncut + 1)] <- i.surviving[ranking[1:ncut]]
i.ranked <- i.ranked - ncut
i.surviving <- i.surviving[-ranking[1:ncut]]
current_done <- n - length(i.surviving)
setTxtProgressBar(pb, max(1, min(current_done, n)))
flush.console()
}
close(pb)
return(ranked.list)
}
getWeights <- function(test.fold, X) {
# Fit a linear SVM model and obtain feature weights
train.data <- X
if (!is.null(test.fold)) {
train.data <- X[-test.fold, , drop = FALSE]
}
svmModel <- svm(
x = train.data[, -1, drop = FALSE],
y = train.data[, 1],
cost = 10,
cachesize = 500,
scale = FALSE,
type = "C-classification",
kernel = "linear"
)
w <- t(svmModel$coefs) %*% svmModel$SV
return(as.vector(w))
}
WriteFeatures <- function(results, input, save = TRUE, file = "features_ranked.txt") {
# Compile feature rankings across multiple folds
rank.matrix <- sapply(results, function(x) {
sort(x$feature.ids, index.return = TRUE)$ix
})
if (is.vector(rank.matrix)) {
rank.matrix <- matrix(rank.matrix, ncol = 1)
}
avg.rank <- apply(rank.matrix, 1, mean)
ord <- sort(avg.rank, index.return = TRUE)
featureID <- ord$ix
avg.rank.sorted <- ord$x
feature.name <- colnames(input[, -1, drop = FALSE])[featureID]
features.ranked <- data.frame(
FeatureName = feature.name,
FeatureID = featureID,
AvgRank = avg.rank.sorted,
stringsAsFactors = FALSE
)
if (save) {
write.table(features.ranked, file = file, quote = FALSE, row.names = FALSE, sep = "\t")
} else {
return(features.ranked)
}
}
FeatSweep.wrap <- function(i, results, input) {
# Wrapper to estimate generalization error across all hold-out folds,
# for a given number of top features
svm.list <- lapply(results, function(x) {
out <- tryCatch({
train.x <- input[x$train.data.ids, 1 + x$feature.ids[1:i], drop = FALSE]
train.y <- input[x$train.data.ids, 1]
test.x <- input[x$test.data.ids, 1 + x$feature.ids[1:i], drop = FALSE]
test.y <- input[x$test.data.ids, 1]
# Step 1: inner tuning on training set only
best.par <- tune(
svm,
train.x = train.x,
train.y = train.y,
ranges = list(gamma = 2^(-12:0), cost = 2^(-6:6))
)$best.parameters
# Step 2: evaluate on fixed validation set
fit <- svm(
x = train.x,
y = train.y,
gamma = best.par$gamma,
cost = best.par$cost
)
pred <- predict(fit, test.x)
err <- mean(pred != test.y)
data.frame(error = err)
}, error = function(e) {
data.frame(error = NA_real_)
})
return(out)
})
err.vec <- sapply(svm.list, function(x) x$error)
error <- mean(err.vec, na.rm = TRUE)
if (is.nan(error)) {
error <- NA_real_
}
return(list(svm.list = svm.list, error = error))
}
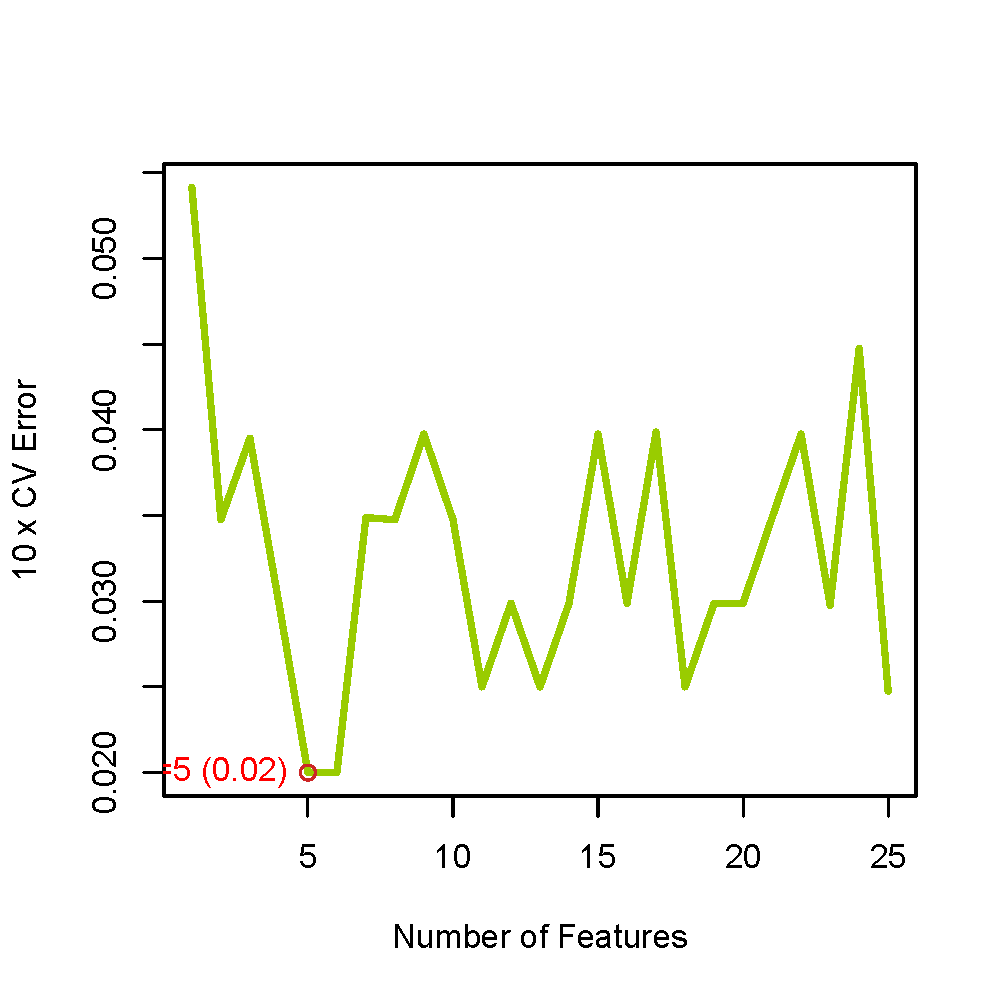
PlotErrors <- function(errors, errors2 = NULL, no.info = 0.5,
ylim = range(c(errors, errors2), na.rm = TRUE),
xlab = "Number of Features", ylab = "10 x CV Error") {
# Makes a plot of average generalization error vs. number of top features
AddLine <- function(x, col = "#99CC00FF") {
idx <- which(!is.na(x))
if (length(idx) == 0) return(NULL)
lines(idx, x[idx], col = col, lwd = 3)
points(which.min(x), min(x, na.rm = TRUE), col = "firebrick3")
text(
which.min(x),
min(x, na.rm = TRUE),
paste0("n=", which.min(x), " (", format(min(x, na.rm = TRUE), digits = 3), ")"),
pos = 2,
col = "red",
cex = 1
)
}
plot(seq_along(errors), errors, type = "n", ylim = ylim, xlab = xlab, ylab = ylab)
AddLine(errors)
if (!is.null(errors2)) AddLine(errors2, "gray30")
abline(h = no.info, lty = 2)
}
Plotaccuracy <- function(errors, errors2 = NULL, no.info = 0.5,
ylim = range(c(errors, errors2), na.rm = TRUE),
xlab = "Number of Features", ylab = "10 x CV Accuracy") {
# Makes a plot of average generalization accuracy vs. number of top features
AddLine <- function(x, col = "#99CC00FF") {
idx <- which(!is.na(x))
if (length(idx) == 0) return(NULL)
lines(idx, x[idx], col = col, lwd = 3)
points(which.max(x), max(x, na.rm = TRUE), col = "firebrick3")
text(
which.max(x),
max(x, na.rm = TRUE),
paste0("n=", which.max(x), " (", format(max(x, na.rm = TRUE), digits = 3), ")"),
pos = 2,
col = "red",
cex = 1
)
}
plot(seq_along(errors), errors, type = "n", ylim = ylim, xlab = xlab, ylab = ylab)
AddLine(errors)
if (!is.null(errors2)) AddLine(errors2, "gray30")
abline(h = no.info, lty = 2)
}
#单独的脚本结束
#脚本二,单独另存为.R格式,准备好之后,只需要运行脚本二即可
##############################
## SVM-RFE 最终定向版(优化完整版)
## 目的:
## 1. 对 merge.Top1000.variance.txt 进行 SVM-RFE
## 2. 放宽筛选,避免最终基因数过少
## 3. 最终结果必须包含 genename
## 4. 输出错误率图和准确率图
## 5. 将特征评估上限限制为25,避免过度扫描
## 6. 只输出 1 个最终基因txt文件
##############################
##############################
## 0. 环境准备
##############################
.libPaths(c(Sys.getenv("R_LIBS_USER"), .libPaths()))
options(stringsAsFactors = FALSE)
suppressPackageStartupMessages({
library(limma)
library(e1071)
})
##############################
## 1. 文件与目录
##############################
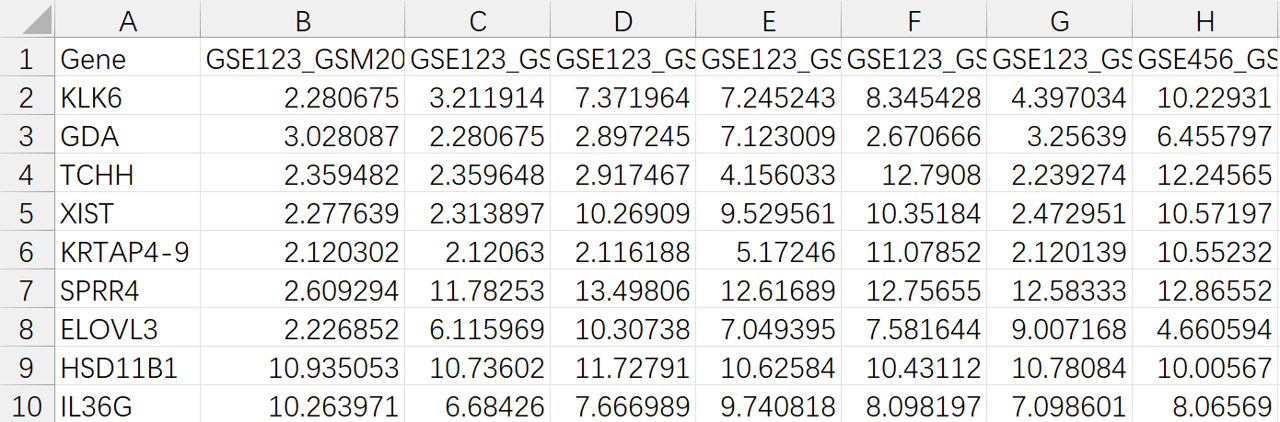
expFile <- "merge.Top1000.variance.txt"
setwd("C:/Users/Administrator/Desktop/6.机器学习/2.SVM")
source("AI21.msvmRFE.R")
target_genes <- c("genename1", "genename2", "genename3")
force_include_target <- TRUE
##############################
## 2. 读取表达矩阵
##############################
rt <- read.table(
expFile,
header = TRUE,
sep = "\t",
check.names = FALSE,
stringsAsFactors = FALSE,
quote = "",
comment.char = ""
)
rt <- as.matrix(rt)
rownames(rt) <- rt[, 1]
exp <- rt[, 2:ncol(rt), drop = FALSE]
dimnames_list <- list(rownames(exp), colnames(exp))
data <- matrix(
as.numeric(as.matrix(exp)),
nrow = nrow(exp),
dimnames = dimnames_list
)
data <- avereps(data)
##############################
## 3. 转置:行=样本,列=基因
##############################
data <- as.data.frame(t(data))
##############################
## 4. 从样本名中提取分组
##############################
group <- gsub("(.*)\\_(.*)\\_(.*)", "\\3", row.names(data))
cat("原始分组识别结果:\n")
print(table(group, useNA = "ifany"))
group[group %in% c("NS", "Normal", "normal", "control", "Control")] <- "Control"
group[group %in% c("PP", "Treat", "treat", "case", "Case", "lesion", "Lesion")] <- "Treat"
cat("映射后的分组结果:\n")
print(table(group, useNA = "ifany"))
if (!all(group %in% c("Control", "Treat"))) {
stop("样本分组解析失败。请检查样本名格式。")
}
data <- cbind(group, data)
data$group <- factor(data$group, levels = c("Control", "Treat"))
##############################
## 5. 缺失值与常数特征处理
##############################
na_cols <- colSums(is.na(data[, -1, drop = FALSE])) > 0
if (any(na_cols)) {
cat("去除含缺失值基因数:", sum(na_cols), "\n")
data <- data[, c(TRUE, !na_cols), drop = FALSE]
}
feature_var <- apply(data[, -1, drop = FALSE], 2, var)
zero_var <- is.na(feature_var) | feature_var == 0
if (any(zero_var)) {
cat("去除零方差基因数:", sum(zero_var), "\n")
data <- data[, c(TRUE, !zero_var), drop = FALSE]
}
##############################
## 6. 基础信息检查
##############################
cat("最终用于SVM的样本数:", nrow(data), "\n")
cat("最终用于SVM的基因数:", ncol(data) - 1, "\n")
cat("分组情况:\n")
print(table(data$group))
cat("目标基因是否在SVM输入矩阵中:\n")
print(target_genes %in% colnames(data)[-1])
cat("存在的目标基因:", intersect(target_genes, colnames(data)[-1]), "\n")
if (length(unique(data$group)) < 2) stop("分组不足,至少需要两组。")
if ((ncol(data) - 1) < 2) stop("可用于分析的基因数过少。")
##############################
## 7. SVM-RFE 特征排序
##############################
set.seed(12345)
cat("开始进行 SVM-RFE 特征排序...\n")
svmRFE(data, k = 10, halve.above = 100)
nfold <- min(5, nrow(data))
if (nfold < 3) nfold <- 3
sampleNum <- nrow(data)
fold_assign <- rep(1:nfold, length.out = sampleNum)[sample(sampleNum)]
folds <- lapply(1:nfold, function(x) which(fold_assign == x))
cat("开始进行", nfold, "折交叉验证特征排序...\n")
results <- vector("list", length(folds))
for (i in seq_along(folds)) {
cat("正在运行 fold", i, "/", length(folds), "...\n")
results[[i]] <- tryCatch(
svmRFE.wrap(folds[[i]], data, k = 10, halve.above = 100),
error = function(e) {
cat("fold", i, "运行失败:", e$message, "\n")
return(NULL)
}
)
}
results <- Filter(Negate(is.null), results)
if (length(results) < 2) {
stop("有效fold结果过少,无法继续后续分析。")
}
##############################
## 8. 汇总特征排序
##############################
top.features <- WriteFeatures(results, data, save = FALSE)
##############################
## 9. 交叉验证评估
##############################
## 将评估上限限制为25,避免过度扫描
num <- min(25, ncol(data) - 1)
cat("开始特征数扫描(1 到", num, ")...\n")
featsweep <- vector("list", num)
for (i in 1:num) {
cat("正在评估前", i, "个特征...\n")
featsweep[[i]] <- tryCatch(
FeatSweep.wrap(i, results, data),
error = function(e) {
cat("前", i, "个特征评估失败:", e$message, "\n")
return(NULL)
}
)
}
errors <- sapply(featsweep, function(x) ifelse(is.null(x), NA, x$error))
valid_idx <- which(!is.na(errors))
if (length(valid_idx) == 0) {
stop("所有特征数评估均失败,无法继续。")
}
valid_errors <- errors[valid_idx]
##############################
## 10. 计算 no.info
##############################
no.info <- min(prop.table(table(data$group)))
##############################
## 11. 绘制错误率图
##############################
pdf(file = "errors_Top1000.pdf", width = 5, height = 5)
PlotErrors(valid_errors, no.info = no.info)
dev.off()
##############################
## 12. 绘制准确率图
##############################
pdf(file = "accuracy_Top1000.pdf", width = 5, height = 5)
Plotaccuracy(1 - valid_errors, no.info = no.info)
dev.off()
##############################
## 13. 选择最佳特征数
##############################
min_error <- min(valid_errors, na.rm = TRUE)
tol <- 0.08
candidate_idx <- valid_idx[valid_errors <= (min_error + tol)]
cat("最小误差:", min_error, "\n")
cat("放宽阈值:", min_error + tol, "\n")
cat("候选特征数:\n")
print(candidate_idx)
if (length(candidate_idx) == 1) {
best_n <- candidate_idx
} else {
pos <- ceiling(0.75 * length(candidate_idx))
best_n <- candidate_idx[pos]
}
best_n <- max(best_n, 15)
best_n <- min(best_n, nrow(top.features))
cat("最终选择特征数 best_n =", best_n, "\n")
##############################
## 14. 生成原始结果并补入目标基因
##############################
final_genes_raw <- as.character(top.features[1:best_n, 1])
genes_in_svm_space <- intersect(target_genes, as.character(top.features[, 1]))
if (force_include_target) {
final_genes <- unique(c(final_genes_raw, genes_in_svm_space))
} else {
final_genes <- final_genes_raw
}
cat("SVM原始筛选基因数:", length(final_genes_raw), "\n")
cat("补入目标基因后最终基因数:", length(final_genes), "\n")
cat("最终结果中包含的目标基因:", intersect(target_genes, final_genes), "\n")
##############################
## 15. 输出最终txt文件
##############################
write.table(
final_genes,
file = "SVM-RFE.final.genes.txt",
sep = "\t",
quote = FALSE,
row.names = FALSE,
col.names = FALSE
)
##############################
## 16. 控制台输出总结
##############################
cat("\n=============================\n")
cat("SVM-RFE 分析完成\n")
cat("=============================\n")
cat("最佳特征数:", best_n, "\n")
cat("最小交叉验证错误率:", min_error, "\n")
cat("最终基因数:", length(final_genes), "\n")
cat("最终结果中目标基因:", paste(intersect(target_genes, final_genes), collapse = ", "), "\n")
cat("输出文件:\n")
cat("1. errors_Top1000.pdf\n")
cat("2. accuracy_Top1000.pdf\n")
cat("3. SVM-RFE.final.genes.txt\n")
cat("=============================\n")
#======================================
# 原创代码无删减,编写不易,论文使用本代码绘图,请引用:www.tcmbiohub.com
# 祝大家投稿顺利!
 TCM Bio Hub⠀⠀⠀