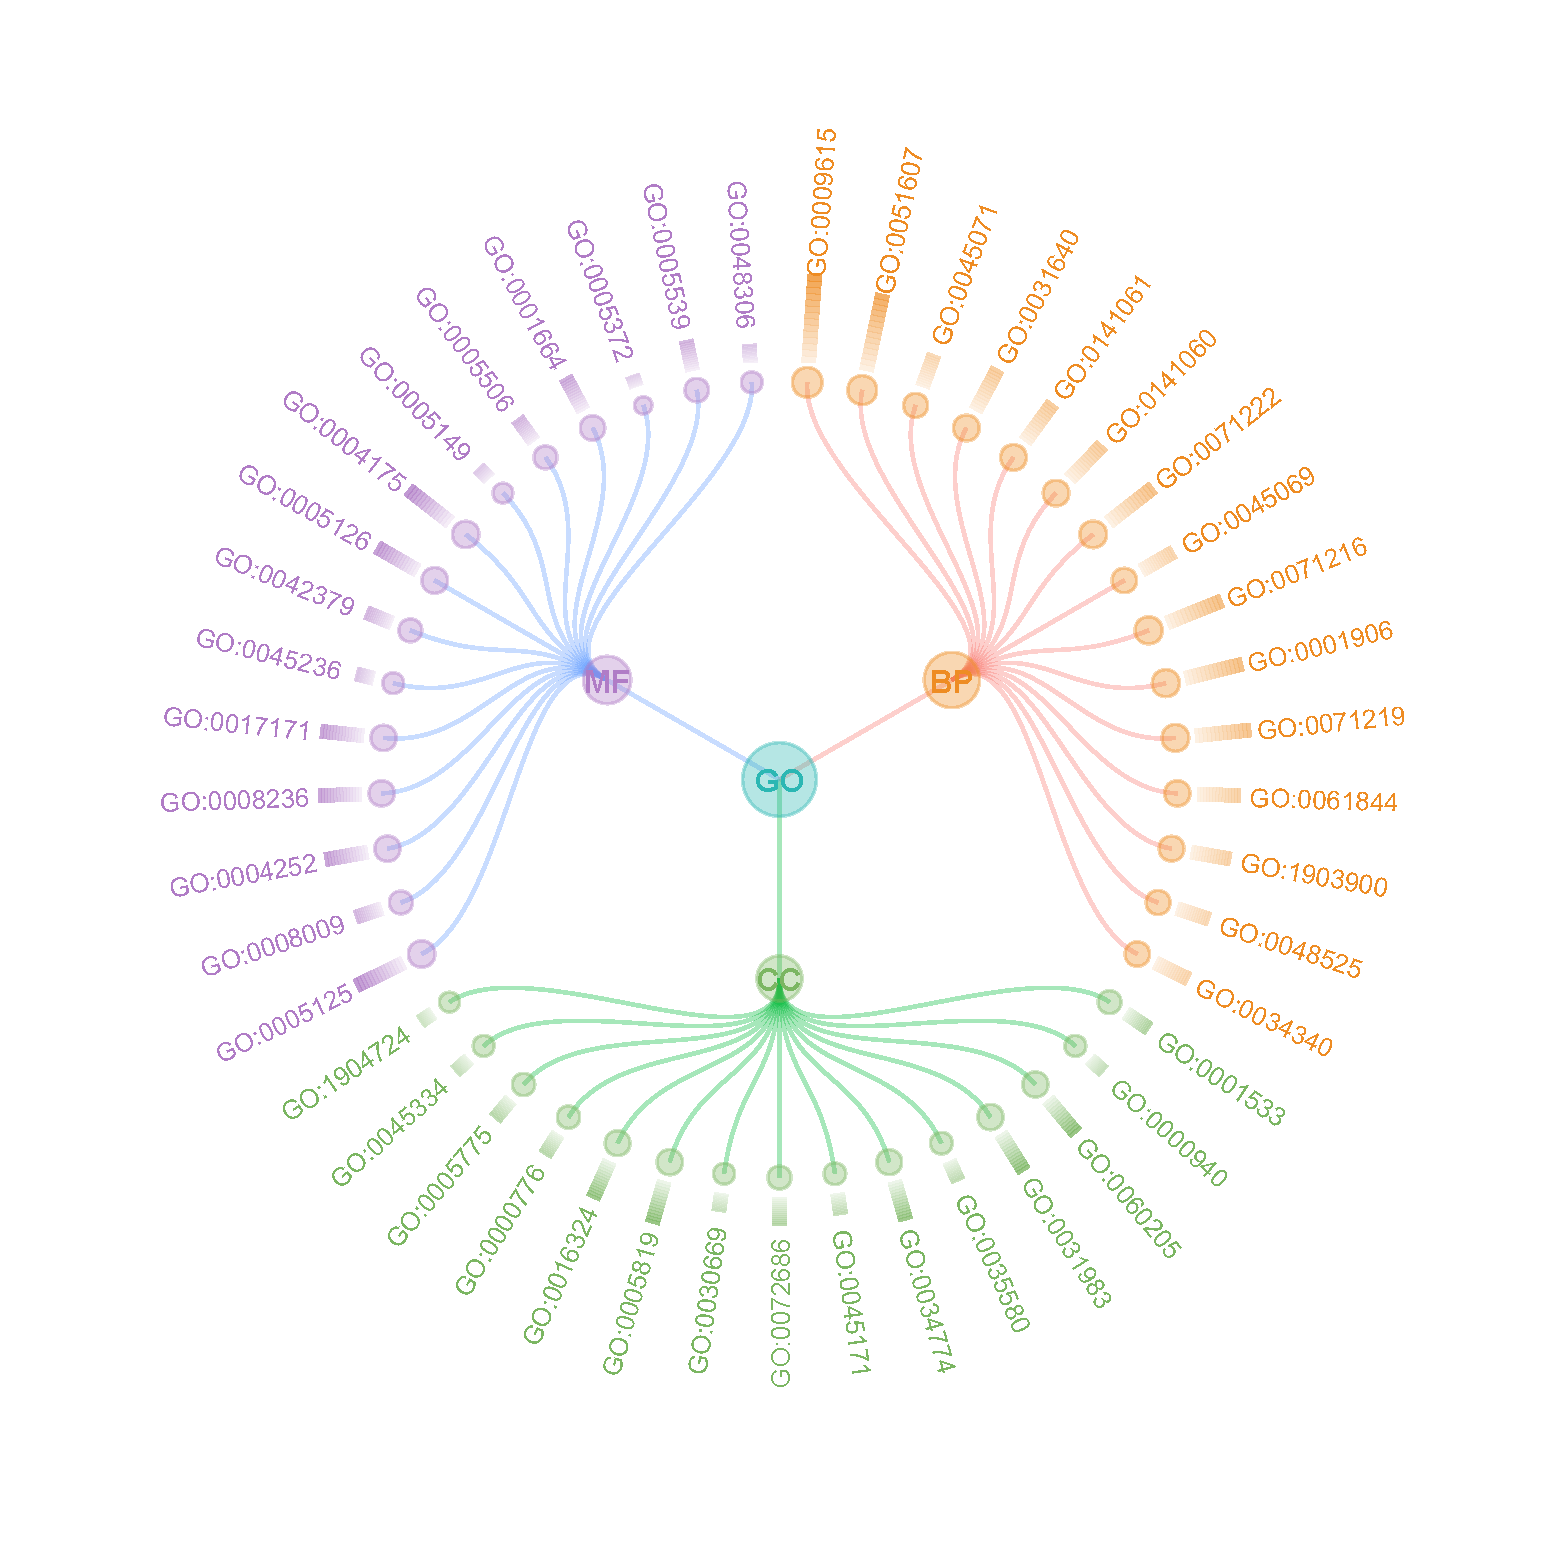
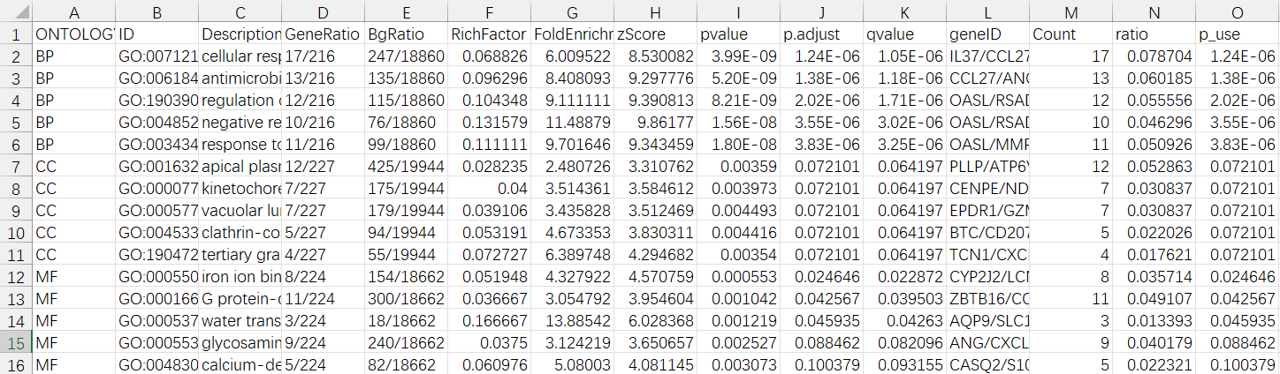
#======================================
# 原创代码无删减,编写不易,论文使用本代码绘图,请引用:www.tcmbiohub.com

# 祝大家投稿顺利!

## =======================================================================
### GO环状圈图 + 外圈“渐变长方形柱” + 叶子标签随柱长动态靠近
### 版本:方式A(手动缩小直径)——关闭自动 xy_lim_auto,并把 xy_lim 调大

# =======================================================================
.libPaths(c(Sys.getenv("R_LIBS_USER"), .libPaths()))
rm(list = ls())


# =======================================================================
suppressPackageStartupMessages({
  library(tidyverse)
  library(clusterProfiler)
  library(org.Hs.eg.db)
  library(igraph)
  library(tidygraph)
  library(ggraph)
  library(cowplot)
  library(scales)
})

# =========================
# 你只需要改这里
# =========================
gene_txt <- "PPDEGs.txt"
prefix   <- "PP"
topN_each_onto <- 15
fdr_cutoff <- 1

leaf_label_mode <- "ID"           # "ID" / "Description" / "Both"
rank_by <- "p.adjust"             # "p.adjust" or "pvalue"
node_size_by <- "Count"           # "Count" or "GeneRatio"

# 外圈柱长度代表什么:Count / GeneRatio / negLog10FDR
bar_by <- "Count"

out_pdf     <- paste0(prefix, "_GO_graph_barRectGradient_labelFollow_smallDiameter.pdf")
out_all_csv <- paste0(prefix, "_GO_all.csv")
out_top_csv <- paste0(prefix, "_GO_TopN_forGraph.csv")

# =========================
# 外圈柱“渐变与丰富度”参数(可调)
# =========================
bar_slices <- 14                # 渐变分段数:10–20
bar_alpha  <- 0.80              # 柱子透明度
bar_len_to <- c(0.03, 0.22)     # 柱长映射区间
gap <- 0.05                     # 柱子起点离叶子点距离
bar_width <- 0.035              # 柱子厚度(0.02–0.06)

# 渐变明暗控制(同一类内不同term深浅有区别)
start_light_to_white <- 0.86
end_min_strength     <- 0.40
end_max_strength     <- 1.00

# =========================
# 叶子标签(GO条码)随柱长靠近(关键参数)
# =========================
label_follow_bar <- TRUE
label_follow_k   <- 0.75
label_follow_cap <- 0.20
label_offset     <- 0.05

# =========================
# 方式A:手动缩小圆圈直径(关闭自动范围 + 调大xy_lim)
# =========================
xy_lim_auto <- FALSE
xy_lim <- 1.78   # ★ 这里控制“直径视觉大小”:越大 -> 图越小(白边更多);建议 1.65–1.95 试一下

# =========================
# 颜色
# =========================
pal <- c(BP = "#EE8C23", CC = "#7BB662", MF = "#B07CC6", GO = "#2BB7B3")

# =========================
# 工具函数:颜色混合(向量版)
# =========================
blend_hex <- function(col_from, col_to, t) {
  t <- pmin(pmax(t, 0), 1)
  rf <- grDevices::col2rgb(col_from) / 255
  rt <- grDevices::col2rgb(col_to) / 255
  r <- rf[1, ] * (1 - t) + rt[1, ] * t
  g <- rf[2, ] * (1 - t) + rt[2, ] * t
  b <- rf[3, ] * (1 - t) + rt[3, ] * t
  grDevices::rgb(r, g, b)
}

# =========================
# 1) SYMBOL -> ENTREZID(含ALIAS补映射)
# =========================
genes_symbol0 <- scan(gene_txt, what = "character", sep = "\n", quiet = TRUE)
genes_symbol0 <- trimws(genes_symbol0)
genes_symbol0 <- unique(genes_symbol0[genes_symbol0 != "" & !is.na(genes_symbol0)])

genes_symbol <- genes_symbol0[nchar(genes_symbol0) > 1]
genes_symbol <- genes_symbol[!tolower(genes_symbol) %in% c("na", "null", "none")]

id_sym <- suppressWarnings(
  bitr(genes_symbol, fromType = "SYMBOL", toType = "ENTREZID", OrgDb = org.Hs.eg.db)
) %>% distinct(ENTREZID, .keep_all = TRUE)

mapped_sym <- unique(id_sym$SYMBOL)
unmapped <- setdiff(genes_symbol, mapped_sym)

id_alias <- tibble()
if (length(unmapped) > 0) {
  id_alias <- suppressWarnings(
    bitr(unmapped, fromType = "ALIAS", toType = "ENTREZID", OrgDb = org.Hs.eg.db)
  ) %>% distinct(ENTREZID, .keep_all = TRUE)
}

de <- unique(c(id_sym$ENTREZID, id_alias$ENTREZID))

cat("Input SYMBOL:", length(genes_symbol), "\n")
cat("Mapped ENTREZID:", length(de), "\n")
if (length(de) < 10) stop("映射到的ENTREZID太少,无法稳定做GO富集。")

final_mapped_symbols <- unique(c(id_sym$SYMBOL, id_alias$ALIAS))
final_unmapped <- setdiff(genes_symbol, final_mapped_symbols)
writeLines(final_unmapped, paste0(prefix, "_unmapped_symbols.txt"))

# =========================
# 2) enrichGO(ALL)并导出全量
# =========================
ego <- enrichGO(
  gene          = de,
  OrgDb         = org.Hs.eg.db,
  keyType       = "ENTREZID",
  ont           = "ALL",
  pvalueCutoff  = 1,
  qvalueCutoff  = 1,
  pAdjustMethod = "BH",
  readable      = FALSE
)

go_df <- tryCatch({
  setReadable(ego, OrgDb = org.Hs.eg.db, keyType = "ENTREZID") %>% as.data.frame()
}, error = function(e) {
  as.data.frame(ego)
})

if (nrow(go_df) == 0) stop("enrichGO 没有任何结果,请检查输入基因或映射。")

write.csv(go_df, out_all_csv, row.names = FALSE)
cat("Saved GO all -> ", out_all_csv, "\n", sep = "")

# =========================
# 3) TopN筛选并导出
# =========================
need_cols <- c("ONTOLOGY", "ID", "Description", "Count", "GeneRatio")
miss <- setdiff(need_cols, colnames(go_df))
if (length(miss) > 0) stop("GO结果缺少列:", paste(miss, collapse = ", "))

parse_ratio <- function(x) {
  out <- rep(NA_real_, length(x))
  for (i in seq_along(x)) {
    s <- as.character(x[i])
    if (is.na(s) || !grepl("/", s, fixed = TRUE)) next
    sp <- strsplit(s, "/", fixed = TRUE)[[1]]
    if (length(sp) != 2) next
    num <- suppressWarnings(as.numeric(sp[1]))
    den <- suppressWarnings(as.numeric(sp[2]))
    if (is.na(num) || is.na(den) || den == 0) next
    out[i] <- num / den
  }
  out
}

go_df2 <- go_df %>%
  mutate(
    Count = as.numeric(Count),
    ratio = parse_ratio(GeneRatio),
    p.adjust = if ("p.adjust" %in% colnames(.)) as.numeric(p.adjust) else NA_real_,
    pvalue   = if ("pvalue"   %in% colnames(.)) as.numeric(pvalue)   else NA_real_
  )

if (!(rank_by %in% colnames(go_df2))) {
  message("未检测到你指定的排序列:", rank_by, ",自动改用 p.adjust 或 pvalue。")
  rank_by <- intersect(c("p.adjust", "pvalue"), colnames(go_df2))[1]
  if (is.na(rank_by)) stop("GO结果里既没有 p.adjust 也没有 pvalue,无法按显著性排序。")
}

go_df2 <- go_df2 %>%
  mutate(p_use = .data[[rank_by]]) %>%
  mutate(p_use = ifelse(is.na(p_use), 1, p_use)) %>%
  mutate(p_use = pmax(p_use, 1e-300))

if (rank_by == "p.adjust") {
  go_df2_f <- go_df2 %>% filter(p_use < fdr_cutoff)
  if (nrow(go_df2_f) == 0) {
    message("FDR筛选后为0条,自动取消硬筛,只按TopN取。")
    go_df2_f <- go_df2
  }
} else {
  go_df2_f <- go_df2
}

go_top <- go_df2_f %>%
  filter(ONTOLOGY %in% c("BP", "CC", "MF")) %>%
  group_by(ONTOLOGY) %>%
  arrange(p_use, desc(Count), .by_group = TRUE) %>%
  slice_head(n = topN_each_onto) %>%
  ungroup() %>%
  distinct(ONTOLOGY, ID, .keep_all = TRUE)

if (nrow(go_top) == 0) stop("筛选后没有任何 term 可画:请调大 topN 或放宽 fdr_cutoff。")

write.csv(go_top, out_top_csv, row.names = FALSE)
cat("Saved GO TopN -> ", out_top_csv, "\n", sep = "")

# =========================
# 4) 构建网络:GO -> (BP/CC/MF) -> term
# =========================
go_top <- go_df2_f %>%
  filter(ONTOLOGY %in% c("BP", "CC", "MF")) %>%
  group_by(ONTOLOGY) %>%
  arrange(p_use, desc(Count), .by_group = TRUE) %>%
  slice_head(n = topN_each_onto) %>%
  ungroup() %>%
  distinct(ONTOLOGY, ID, .keep_all = TRUE) %>%
  mutate(
    Description2 = str_remove(Description, ",.*"),
    label_term = case_when(
      leaf_label_mode == "ID" ~ ID,
      leaf_label_mode == "Description" ~ str_wrap(Description2, width = 26),
      leaf_label_mode == "Both" ~ str_wrap(paste0(ID, ": ", Description2), width = 30),
      TRUE ~ ID
    )
  )

if (node_size_by == "GeneRatio") {
  go_top <- go_top %>% mutate(node_size_term = ifelse(is.na(ratio), Count, ratio * 100))
} else {
  go_top <- go_top %>% mutate(node_size_term = Count)
}

go_top <- go_top %>%
  mutate(
    bar_value = case_when(
      bar_by == "Count" ~ as.numeric(Count),
      bar_by == "GeneRatio" ~ as.numeric(ratio),
      bar_by == "negLog10FDR" ~ -log10(pmax(p_use, 1e-300)),
      TRUE ~ as.numeric(Count)
    )
  )

node_root <- tibble(
  name = "GO",
  node_size = sum(go_top$node_size_term, na.rm = TRUE),
  node_level = "Type",
  type = "GO",
  label = "GO",
  bar_value = NA_real_
)

node_onto <- go_top %>%
  group_by(ONTOLOGY) %>%
  summarise(node_size = sum(node_size_term, na.rm = TRUE), .groups = "drop") %>%
  transmute(
    name = ONTOLOGY,
    node_size = node_size,
    node_level = "ONTOLOGY",
    type = ONTOLOGY,
    label = ONTOLOGY,
    bar_value = NA_real_
  )

node_term <- go_top %>%
  transmute(
    name = ID,
    node_size = node_size_term,
    node_level = "ID",
    type = ONTOLOGY,
    label = label_term,
    bar_value = as.numeric(bar_value)
  )

node_file <- bind_rows(node_root, node_onto, node_term) %>%
  distinct(name, .keep_all = TRUE)

edge_1 <- node_onto %>% transmute(from = "GO", to = name)
edge_2 <- go_top %>% transmute(from = ONTOLOGY, to = ID) %>% distinct()
edge_file <- bind_rows(edge_1, edge_2)

graph_go <- tbl_graph(nodes = node_file, edges = edge_file, directed = TRUE)

# =========================
# 5) 作图
# =========================
lay <- ggraph::create_layout(graph_go, layout = "dendrogram", circular = TRUE)

bar_df <- lay %>%
  as_tibble() %>%
  filter(node_level == "ID") %>%
  mutate(
    r  = sqrt(x^2 + y^2),
    r  = ifelse(r == 0, 1e-6, r),
    ux = x / r,
    uy = y / r,
    v  = as.numeric(bar_value),
    base_col = unname(pal[type])
  )

if (all(is.na(bar_df$v))) stop("bar_value 全部为 NA:请检查 bar_by 或输入数据。")
bar_df$v[is.na(bar_df$v)] <- min(bar_df$v, na.rm = TRUE)

v_rng <- range(bar_df$v, na.rm = TRUE)
if (!all(is.finite(v_rng)) || v_rng[1] == v_rng[2]) {
  bar_df <- bar_df %>% mutate(bar_len = mean(bar_len_to))
} else {
  bar_df <- bar_df %>% mutate(bar_len = scales::rescale(v, to = bar_len_to, from = v_rng))
}

bar_df <- bar_df %>%
  group_by(type) %>%
  mutate(
    v01 = {
      rr <- range(v, na.rm = TRUE)
      if (!all(is.finite(rr)) || rr[1] == rr[2]) rep(0.6, n())
      else scales::rescale(v, to = c(0, 1), from = rr)
    }
  ) %>%
  ungroup()

w <- bar_width / 2
bar_df <- bar_df %>%
  mutate(
    px = -uy,
    py =  ux,
    rin = r + gap
  )

slice_df <- bar_df %>%
  tidyr::expand_grid(slice = seq_len(bar_slices)) %>%
  mutate(
    t0   = (slice - 1) / bar_slices,
    t1   = slice / bar_slices,
    tmid = (t0 + t1) / 2,
    rin_s  = rin + bar_len * t0,
    rout_s = rin + bar_len * t1,
    x_in  = rin_s  * ux,
    y_in  = rin_s  * uy,
    x_out = rout_s * ux,
    y_out = rout_s * uy
  ) %>%
  mutate(
    start_col = blend_hex(base_col, rep("#FFFFFF", n()), rep(start_light_to_white, n())),
    end_strength = end_min_strength + (end_max_strength - end_min_strength) * v01,
    end_col = blend_hex(rep("#FFFFFF", n()), base_col, end_strength),
    slice_fill = blend_hex(start_col, end_col, tmid)
  )

bar_poly <- bind_rows(
  slice_df %>% transmute(id = name, slice = slice, fill = slice_fill, ord = 1,
                         x = x_in  + w*px, y = y_in  + w*py),
  slice_df %>% transmute(id = name, slice = slice, fill = slice_fill, ord = 2,
                         x = x_out + w*px, y = y_out + w*py),
  slice_df %>% transmute(id = name, slice = slice, fill = slice_fill, ord = 3,
                         x = x_out - w*px, y = y_out - w*py),
  slice_df %>% transmute(id = name, slice = slice, fill = slice_fill, ord = 4,
                         x = x_in  - w*px, y = y_in  - w*py)
) %>% arrange(id, slice, ord)

label_df <- bar_df %>%
  mutate(
    follow = if (label_follow_bar) pmin(bar_len * label_follow_k, label_follow_cap) else 0,
    r_lab  = rin + follow + label_offset,
    x_lab  = r_lab * ux,
    y_lab  = r_lab * uy
  ) %>%
  select(name, x_lab, y_lab, type) %>%
  left_join(lay %>% as_tibble() %>% select(name, label), by = "name")

p <- ggraph(lay) +
  geom_polygon(
    data = bar_poly,
    aes(x = x, y = y, group = interaction(id, slice), fill = fill),
    alpha = bar_alpha,
    color = NA,
    show.legend = FALSE
  ) +
  scale_fill_identity() +
  geom_edge_diagonal(aes(color = node2.type), alpha = 0.35, linewidth = 0.6) +
  geom_node_point(aes(size = node_size, color = type), alpha = 0.35) +
  scale_size(range = c(2.5, 12)) +
  scale_color_manual(values = pal, drop = FALSE) +
  geom_text(
    data = label_df,
    aes(
      x = x_lab,
      y = y_lab,
      label = label,
      angle = -((-node_angle(x_lab, y_lab) + 90) %% 180) + 90,
      color = type
    ),
    size = 3.3,
    hjust = "outward"
  ) +
  geom_node_text(
    aes(label = label, filter = !leaf, color = type),
    fontface = "bold", size = 4, family = "sans"
  ) +
  cowplot::theme_nothing() +
  coord_fixed() +
  coord_cartesian(xlim = c(-xy_lim, xy_lim), ylim = c(-xy_lim, xy_lim))

p
ggsave(out_pdf, plot = p, width = 7.8, height = 7.8, device = cairo_pdf)
message("Done. Saved plot -> ", out_pdf)

#======================================
# 原创代码无删减,编写不易,论文使用本代码绘图,请引用:www.tcmbiohub.com

# 祝大家投稿顺利!
 TCM Bio Hub⠀⠀⠀