#======================================
# 原创代码无删减,编写不易,若使用代码绘图,请引用:www.tcmbiohub.com
# 祝大家投稿顺利!
## RRA “伪曼哈顿图” + 渐变色(按 meanLogFC)完整脚本
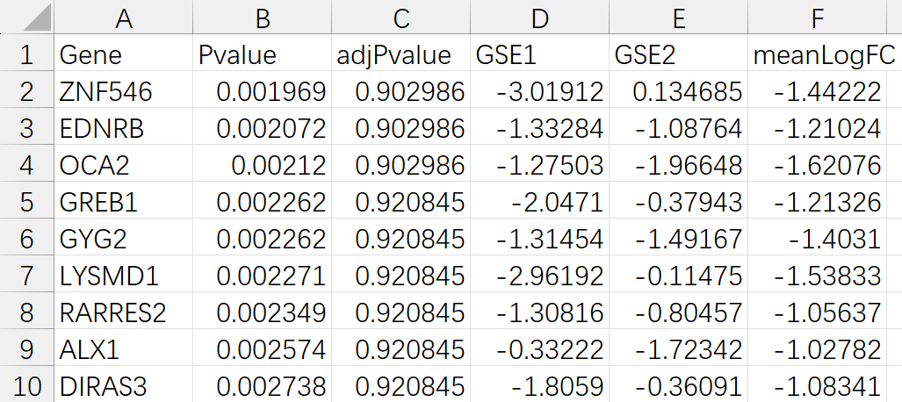
## 输入文件(放在同一工作目录):
## up_all.txt, down_all.txt (未筛选全量)
## up.txt, down.txt (可手动筛选,用于放大+标注)
##
## 横坐标含义:
## idx = 按 Gene 字母排序后的顺序索引(1,2,3,...)
## block = 把 idx 均分成 18 段的段号(0–17)
##=========
pkgs <- c("ggplot2", "ggrepel", "dplyr", "scales")
to_install <- pkgs[!pkgs %in% rownames(installed.packages())]
if (length(to_install) > 0) install.packages(to_install, dependencies = TRUE)
invisible(lapply(pkgs, library, character.only = TRUE))
## 1) 文件
up_all_file <- "up_all.txt"
down_all_file <- "down_all.txt"
up_sel_file <- "up.txt"
down_sel_file <- "down.txt"
out_tiff <- "RRA_block_plot_gradient_noGreyBand.tiff"
out_png <- "RRA_block_plot_gradient_noGreyBand.png"
out_pdf <- "RRA_block_plot_gradient_noGreyBand.pdf" # 新增:PDF输出
n_block <- 18
label_n_each <- 15
## 2) 读入函数
read_rra_table <- function(file){
if (!file.exists(file)) stop(paste0("找不到文件:", file))
df <- read.delim(file, header = TRUE, sep = "\t",
stringsAsFactors = FALSE, check.names = FALSE)
cn <- colnames(df)
pick_col <- function(target){
if (target %in% cn) return(target)
hit <- cn[tolower(cn) == tolower(target)]
if (length(hit) == 1) return(hit)
return(NA_character_)
}
gene_col <- pick_col("Gene")
p_col <- pick_col("Pvalue")
padj_col <- pick_col("adjPvalue")
mfc_col <- pick_col("meanLogFC")
if (is.na(gene_col)) stop(paste0("File ", file, " 缺少 Gene 列"))
if (is.na(p_col)) stop(paste0("File ", file, " 缺少 Pvalue 列"))
if (is.na(padj_col)) stop(paste0("File ", file, " 缺少 adjPvalue 列"))
if (is.na(mfc_col)) stop(paste0("File ", file, " 缺少 meanLogFC 列"))
out <- df[, c(gene_col, p_col, padj_col, mfc_col)]
colnames(out) <- c("Gene", "Pvalue", "adjPvalue", "meanLogFC")
out <- out[!is.na(out$Gene) & out$Gene != "", ]
out$Pvalue <- suppressWarnings(as.numeric(out$Pvalue))
out$adjPvalue <- suppressWarnings(as.numeric(out$adjPvalue))
out$meanLogFC <- suppressWarnings(as.numeric(out$meanLogFC))
out
}
read_gene_list <- function(file){
if (!file.exists(file)) stop(paste0("找不到文件:", file))
df <- read.delim(file, header = TRUE, sep = "\t",
stringsAsFactors = FALSE, check.names = FALSE)
if ("Gene" %in% colnames(df)) return(unique(df$Gene))
unique(df[[1]])
}
## 3) 读入数据
up_all <- read_rra_table(up_all_file)
down_all <- read_rra_table(down_all_file)
up_genes <- read_gene_list(up_sel_file)
down_genes <- read_gene_list(down_sel_file)
df_all <- dplyr::full_join(
up_all %>% dplyr::rename(Pvalue_up = Pvalue, adjPvalue_up = adjPvalue, meanLogFC_up = meanLogFC),
down_all %>% dplyr::rename(Pvalue_down = Pvalue, adjPvalue_down = adjPvalue, meanLogFC_down = meanLogFC),
by = "Gene"
)
df_all$meanLogFC <- ifelse(!is.na(df_all$meanLogFC_up), df_all$meanLogFC_up, df_all$meanLogFC_down)
df_all$Pvalue <- ifelse(df_all$meanLogFC >= 0, df_all$Pvalue_up, df_all$Pvalue_down)
df_all$adjPvalue <- ifelse(df_all$meanLogFC >= 0, df_all$adjPvalue_up, df_all$adjPvalue_down)
df_plot <- df_all %>%
dplyr::select(Gene, Pvalue, adjPvalue, meanLogFC) %>%
dplyr::filter(!is.na(meanLogFC)) %>%
dplyr::distinct(Gene, .keep_all = TRUE)
if (nrow(df_plot) == 0) stop("df_plot 是空的:请检查输入文件是否为空或 meanLogFC 是否全是 NA。")
df_plot$Selected <- ifelse(df_plot$Gene %in% up_genes | df_plot$Gene %in% down_genes, "Selected", "All")
df_plot$Selected <- factor(df_plot$Selected, levels = c("All", "Selected"))
## 4) 分块
df_plot <- df_plot %>% dplyr::arrange(Gene)
df_plot$idx <- seq_len(nrow(df_plot))
n_block_use <- min(n_block, nrow(df_plot))
if (n_block_use < 1) n_block_use <- 1
if (n_block_use == 1) {
df_plot$block <- factor(0)
} else {
df_plot$block <- cut(df_plot$idx, breaks = n_block_use,
labels = 0:(n_block_use - 1), include.lowest = TRUE)
}
block_df <- df_plot %>%
dplyr::group_by(block) %>%
dplyr::summarise(xmin = min(idx), xmax = max(idx), .groups = "drop") %>%
dplyr::mutate(
block_num = as.integer(as.character(block)),
xmid = (xmin + xmax) / 2
)
ymax_abs <- max(abs(df_plot$meanLogFC), na.rm = TRUE)
band_h <- max(0.15, 0.06 * ymax_abs)
block_cols <- scales::hue_pal()(n_block_use)
names(block_cols) <- as.character(0:(n_block_use - 1))
## 5) 标注
df_plot$ColorGroup <- ifelse(df_plot$meanLogFC >= 0, "UP", "DOWN")
label_df <- df_plot %>%
dplyr::filter(Selected == "Selected") %>%
dplyr::group_by(ColorGroup) %>%
dplyr::arrange(dplyr::desc(abs(meanLogFC))) %>%
dplyr::slice_head(n = label_n_each) %>%
dplyr::ungroup()
## 6) 作图(已去掉背景灰条带那一层 geom_rect(bg1...))
p <- ggplot(df_plot, aes(x = idx, y = meanLogFC)) +
## 0线彩色条(按 block 上色)
geom_rect(
data = block_df,
aes(xmin = xmin - 0.5, xmax = xmax + 0.5, ymin = -band_h, ymax = band_h, fill = as.character(block)),
inherit.aes = FALSE,
alpha = 0.95,
color = NA
) +
## 0线
geom_hline(yintercept = 0, linewidth = 0.4) +
## 所有点:颜色按 meanLogFC 渐变
geom_point(aes(color = meanLogFC), size = 1.1, alpha = 0.75) +
## 你筛选的点:再叠一层放大
geom_point(
data = df_plot %>% dplyr::filter(Selected == "Selected"),
aes(color = meanLogFC),
size = 2.2,
alpha = 0.95
) +
## 标注
ggrepel::geom_text_repel(
data = label_df,
aes(label = Gene, color = meanLogFC),
size = 3.0,
max.overlaps = Inf,
box.padding = 0.35,
point.padding = 0.15,
segment.alpha = 0.35
) +
## 配色
scale_fill_manual(values = block_cols, guide = "none") +
scale_color_gradient2(
low = "#2BB316",
mid = "#FEFD04",
high = "#E64B35",
midpoint = 0,
name = "meanLogFC"
) +
scale_x_continuous(
breaks = block_df$xmid,
labels = as.character(block_df$block),
expand = expansion(mult = c(0.01, 0.01))
) +
labs(x = "Gene-order bins (0–17)", y = "average log2FC") +
theme_classic(base_size = 12) +
theme(
axis.ticks.x = element_blank(),
axis.text.x = element_text(size = 10),
legend.title = element_blank(),
legend.position = "topleft"
)
## 7) 导出(tiff + png + pdf)
ggsave(out_tiff, p, width = 8, height = 6.5, units = "in", dpi = 400, compression = "lzw")
ggsave(out_png, p, width = 8, height = 6.5, units = "in", dpi = 300)
## 新增:输出PDF(推荐cairo_pdf,字体更稳定;若不支持则自动用pdf)
if (capabilities("cairo")) {
ggsave(out_pdf, p, width = 8, height = 6.5, units = "in", device = cairo_pdf)
} else {
ggsave(out_pdf, p, width = 8, height = 6.5, units = "in", device = "pdf")
}
print(p)
cat("完成:", out_tiff, "\n")
cat("完成:", out_png, "\n")
cat("完成:", out_pdf, "\n")
# 原创代码不易,使用代码绘图,请引用:www.tcmbiohub.com
# 祝大家投稿顺利!
 TCM Bio Hub⠀⠀⠀